Elastic Stack SIEM Homelab
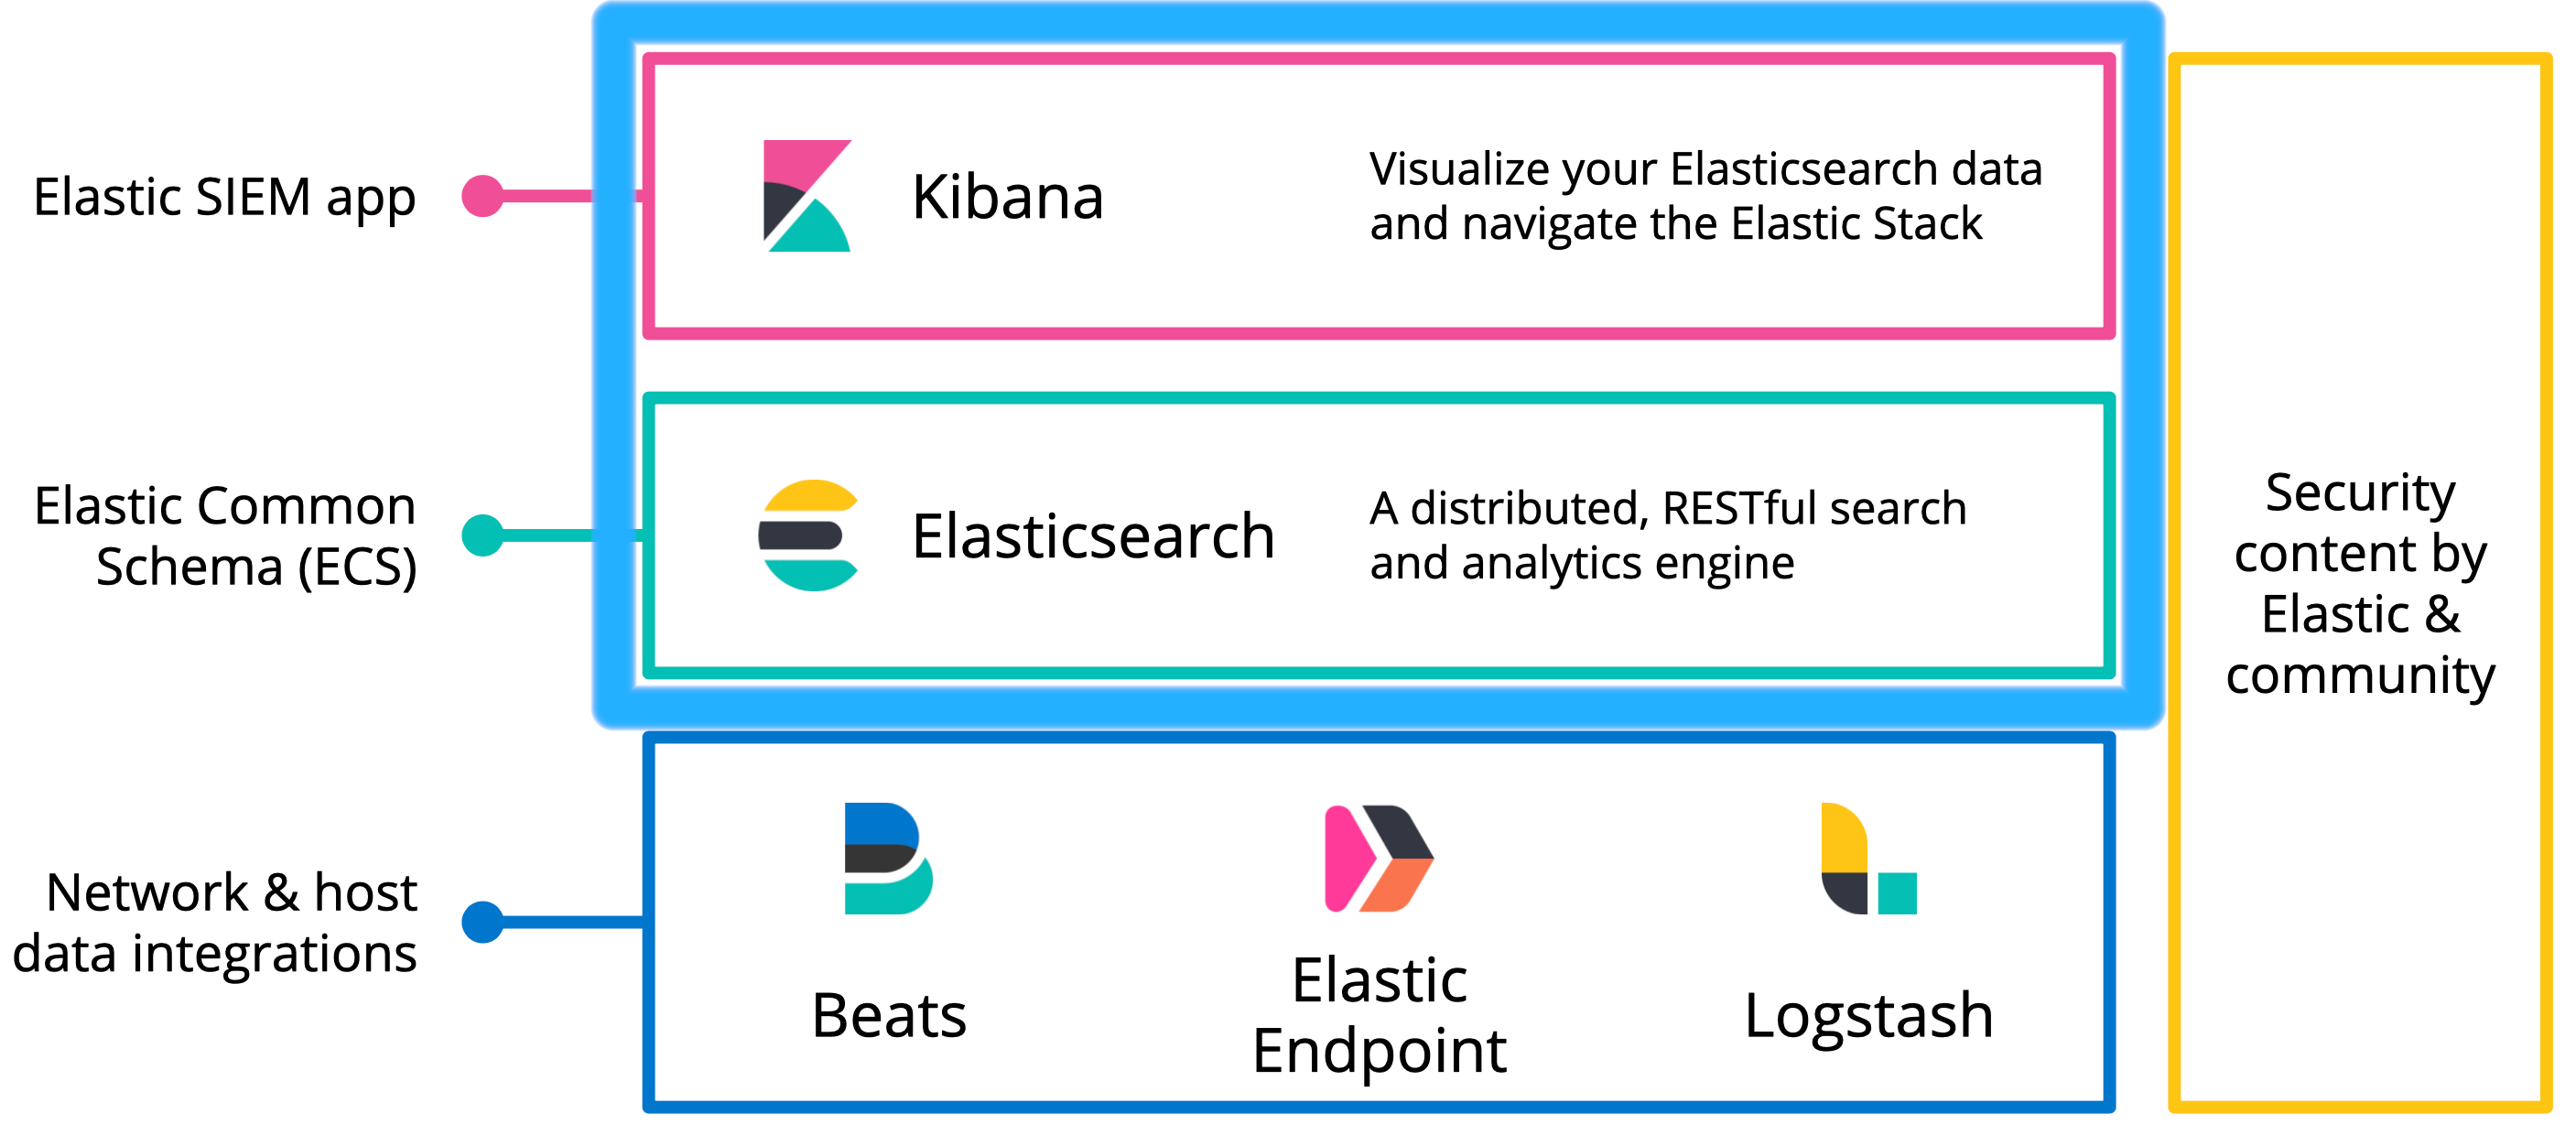
Goal of this post is to cover the steps it takes to provision a Elasticsearch + Kibana SIEM stack, able to use for experimentation and debugging data and features. We’ll get Elasticsearch configured with TLS, provision users, and connect Kibana to ES, and load some sample data.

Originally I followed the guide from Maciej Szymczyk, however bitrot is real, and I had some issues following their footsteps. After search to find fixes lead me to this succinct forum post which clearly demonstrated configuring the certificates, and I expanded upon it below.
Condition⌗
- A single Debian based VM
- Bridged network interface to homelab network
- 2+ CPU cores
- 8GB of RAM to keep JVMs comfortable.
Versions⌗
- Elasticsearch: 7.11.1
- Kibana: 7.11.1
Standard⌗
Virtualbox VM running Debian with Elasticsearch(TLS traffic) + Kibana installed.
See Maciej’s guide Part 1 for the straitforward installation via deb files, or use a simple ansible role such as:
- name: "Install Elasticsearch"
  apt:
    deb: https://artifacts.elastic.co/downloads/elasticsearch/elasticsearch-7.11.2-amd64.deb

- name: "Install Kibana"
  apt:
    deb: https://artifacts.elastic.co/downloads/kibana/kibana-7.11.2-amd64.deb
Elasticsearch Configuration⌗
Generate Certificate Authority(CA)
Utilize Elasticsearch’s certutil tool for generating certificates. This is the most straitforward option to generate the keys, however you can use your own CA to generate keys for nodes and clients, such as in a production environment. Enter /usr/share/elasticsearch to access the certutil tool.
Using instance.yml defined below removes the need for a interactive prompts, otherwise certutil will prompt the user to generate a new CA, ask for configuration location, and an optional password to protect the files, skipped since this example is for testing. Final result is a zip file with the CA crt and key files.
instances:
  - name: "node"
    dns: ["localhost", "debian"]
    ip: ["127.0.0.1"]
Run as root: # ./bin/elasticsearch-certutil cert --keep-ca-key ca --pem --in instance.yml --out certs.zip
Somewhat obviously, this command outputs the certificate authority, and node certificates in the certs.zip artifact.
Now, let’s unpack the zip contents to appropriate locations for Elasticsearch:
# unzip certs.zip

# mkdir /etc/elasticsearch/config
# cp ca/ca.crt /etc/elasticsearch/config/
# cp node/node.* /etc/elasticsearch/config/
Update /etc/elasticsearch/elasticsearch.yml setting
# XPack Security Settings
xpack.security.enabled: true

# SSL Encryption Configuration
xpack.security.transport.ssl.enabled: true
xpack.security.transport.ssl.verification_mode: certificate
xpack.security.transport.ssl.key: "/etc/elasticsearch/config/node.key"
xpack.security.transport.ssl.certificate: "/etc/elasticsearch/config/node.crt"
xpack.security.transport.ssl.certificate_authorities: [ "/etc/elasticsearch/config/ca.crt" ]

# Configure SSL on HTTP APIs
xpack.security.http.ssl.enabled: true
xpack.security.http.ssl.key: /etc/elasticsearch/config/node.key
xpack.security.http.ssl.certificate: /etc/elasticsearch/config/node.crt
xpack.security.http.ssl.certificate_authorities: [ "/etc/elasticsearch/config/ca.crt" ]
Restart Elasticsearch On recent Debian-based releases: systemctl restart elasticsearch.
Optional convenience; as root, add the CA certificate to the machine’s /etc/ssl/certs/ directory:
# cp /etc/elasticsearch/config/ca.crt /etc/ssl/certs/elastic-ca.crt
# chmod 0644 /etc/ssl/certs/elastic-ca.crt
This enables non-root usage of the CA to query ES, for example:
non-root$ curl --cacert /etc/ssl/certs/elastic-ca.crt -XGET "https://localhost:9200" -u elastic
Enter host password for user 'elastic':
{
  "name" : "debian",
  "cluster_name" : "elasti-siem",
  "cluster_uuid" : "kxjX6Bv1SD2HKkDL97p7cw",
  "version" : {
    "number" : "7.11.1",
...
We have basic-authenticated to Elasticsearch!
Stoopdid red-herring error java.security.AccessControlException: access denied ("java.io.FilePermission" "/home/es/config" "read") Following the Elasticsearch encryption docs will lead the operator down the path of creating /home/es/config for storing the TLS certs, however this conflicts with the default ES_HOME directory default: /etc/elasticsearch/, which is where it searches for the config files. The error claiming that it is a FilePermission error is misdirected, the actual problem is the file’s path.
A less confusing option; contrary to defaults in some ES docs and guides, copy the certs to /etc/elasticsearch/config/. With user RO permissions(0400), and owned only by elasticsearch user to retain confidentiality.
Set Elasticsearch user passwords
Use this interactive command to set the passwords for each user. This command communicates with the Elasticsearch API, so it must be running to apply the password changes. Since this is a testing environment, it’s safe to pick a simple password, but don’t repeat in production. Take care to not forget the password used for elastic and kibana_system users, those will be used later.
root@debian:/usr/share/elasticsearch# ./bin/elasticsearch-setup-passwords interactive
Initiating the setup of passwords for reserved users elastic,apm_system,kibana,kibana_system,logstash_system,beats_system,remote_monitoring_user.
You will be prompted to enter passwords as the process progresses.
Please confirm that you would like to continue [y/N]y

Enter password for [elastic]:
Reenter password for [elastic]:
Enter password for [apm_system]:
Reenter password for [apm_system]:
Enter password for [kibana_system]:
Reenter password for [kibana_system]:
Enter password for [logstash_system]:
Reenter password for [logstash_system]:
Enter password for [beats_system]:
Reenter password for [beats_system]:
Enter password for [remote_monitoring_user]:
Reenter password for [remote_monitoring_user]:
Changed password for user [apm_system]
Changed password for user [kibana_system]
Changed password for user [kibana]
Changed password for user [logstash_system]
Changed password for user [beats_system]
Changed password for user [remote_monitoring_user]
Changed password for user [elastic]
Kibana Configuration⌗
Update /etc/kibana/kibana.yml with the following.
elasticsearch.hosts: ["https://localhost:9200"]
elasticsearch.ssl.certificateAuthorities: [ "/etc/ssl/certs/elastic-ca.crt" ]
elasticsearch.ssl.verificationMode: full
elasticsearch.username: "kibana_system"
elasticsearch.password: "pwd-you-set-for-kibana_system-user"
By default, Kibana listens on only it’s local interface on port 5601, so remote machines will not be able to connect.
$ ss -lntp
State               Recv-Q              Send-Q                                  Local Address:Port                             Peer Address:Port
LISTEN              0                   128                                         127.0.0.1:5601                                  0.0.0.0:*
Which can be connected to by forwarding a local port to the vm over ssh: ssh -L 5601:localhost:5601 {VM User}@{IP}, and then accessed at “http://localhost:5601/”. Note that the connection is running insecure basic-auth authentication HTTP, so traffic is sniffable and vulnerable to MITM. Fortunately there are more secure options for Auth[Z,N] to Kibana and Elasticsearch in production environments.
🎉 Kibana Connected 🎉⌗
Use the elastic user:password declared above to authenticate for Admin authorization to make modifications and import data.

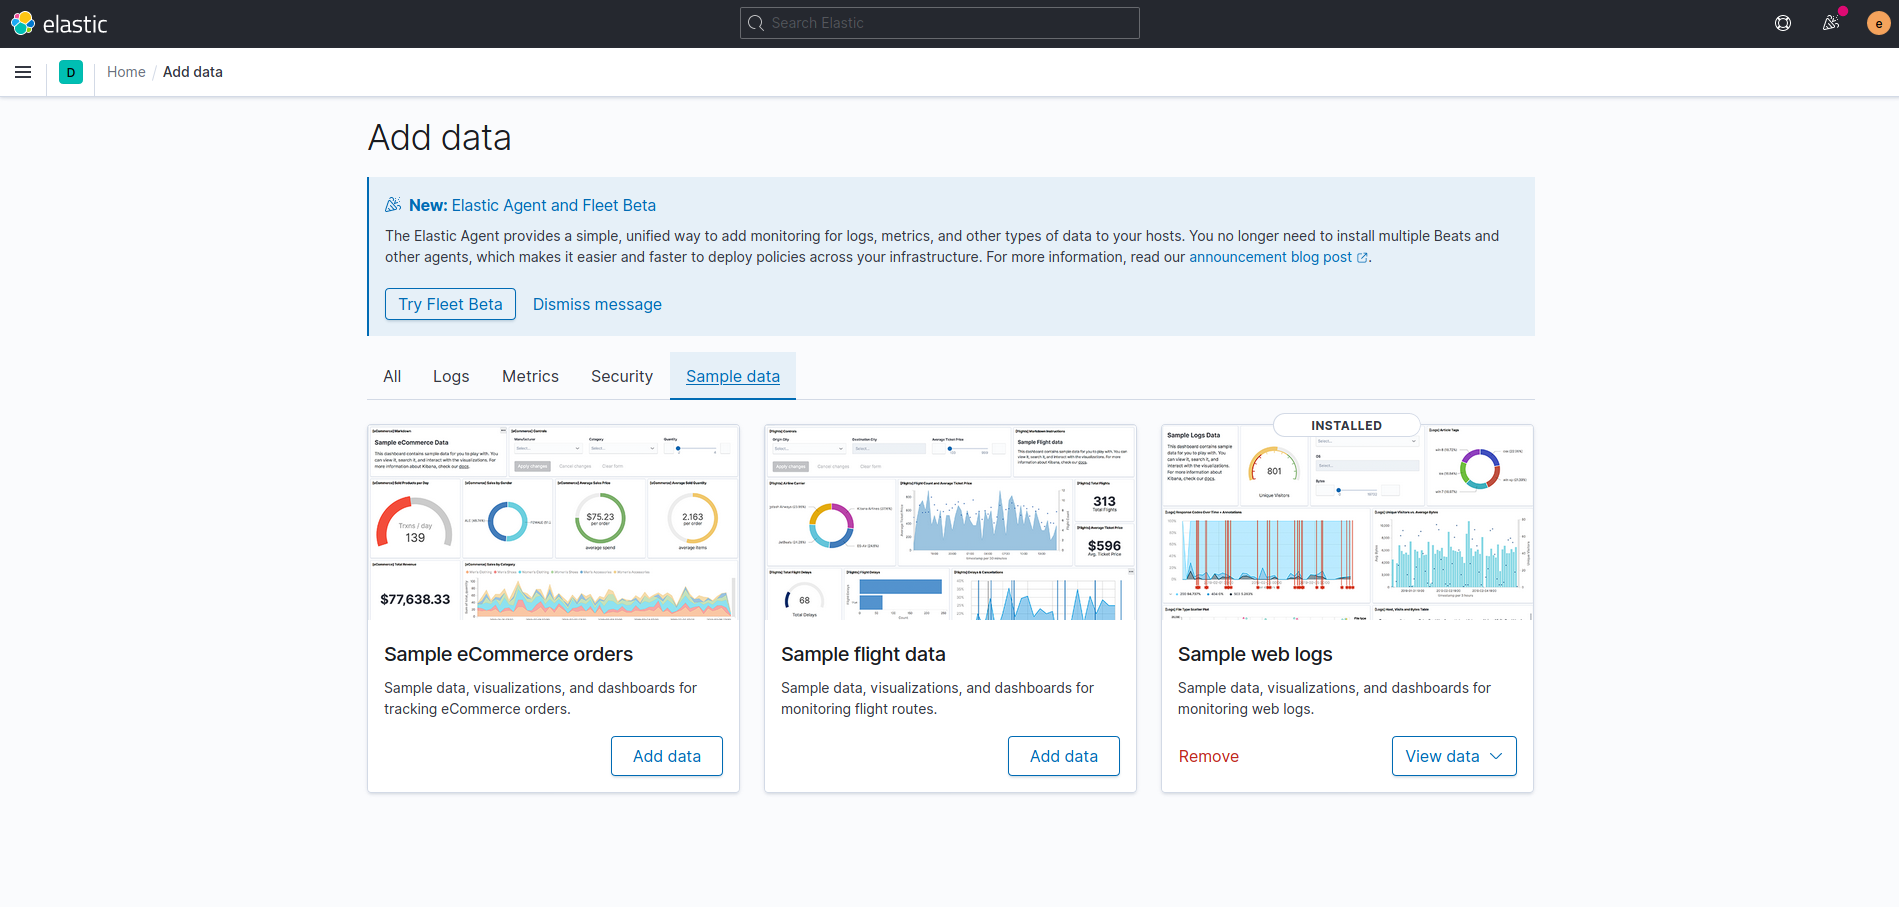
To do bootstrap some sample data to get the feel of Kibana; Home -> Add Data -> Sample Data -> Choose and add data package. Kibana fetches Elastic’s sample data set and writes it to Elasticsearch indexes.

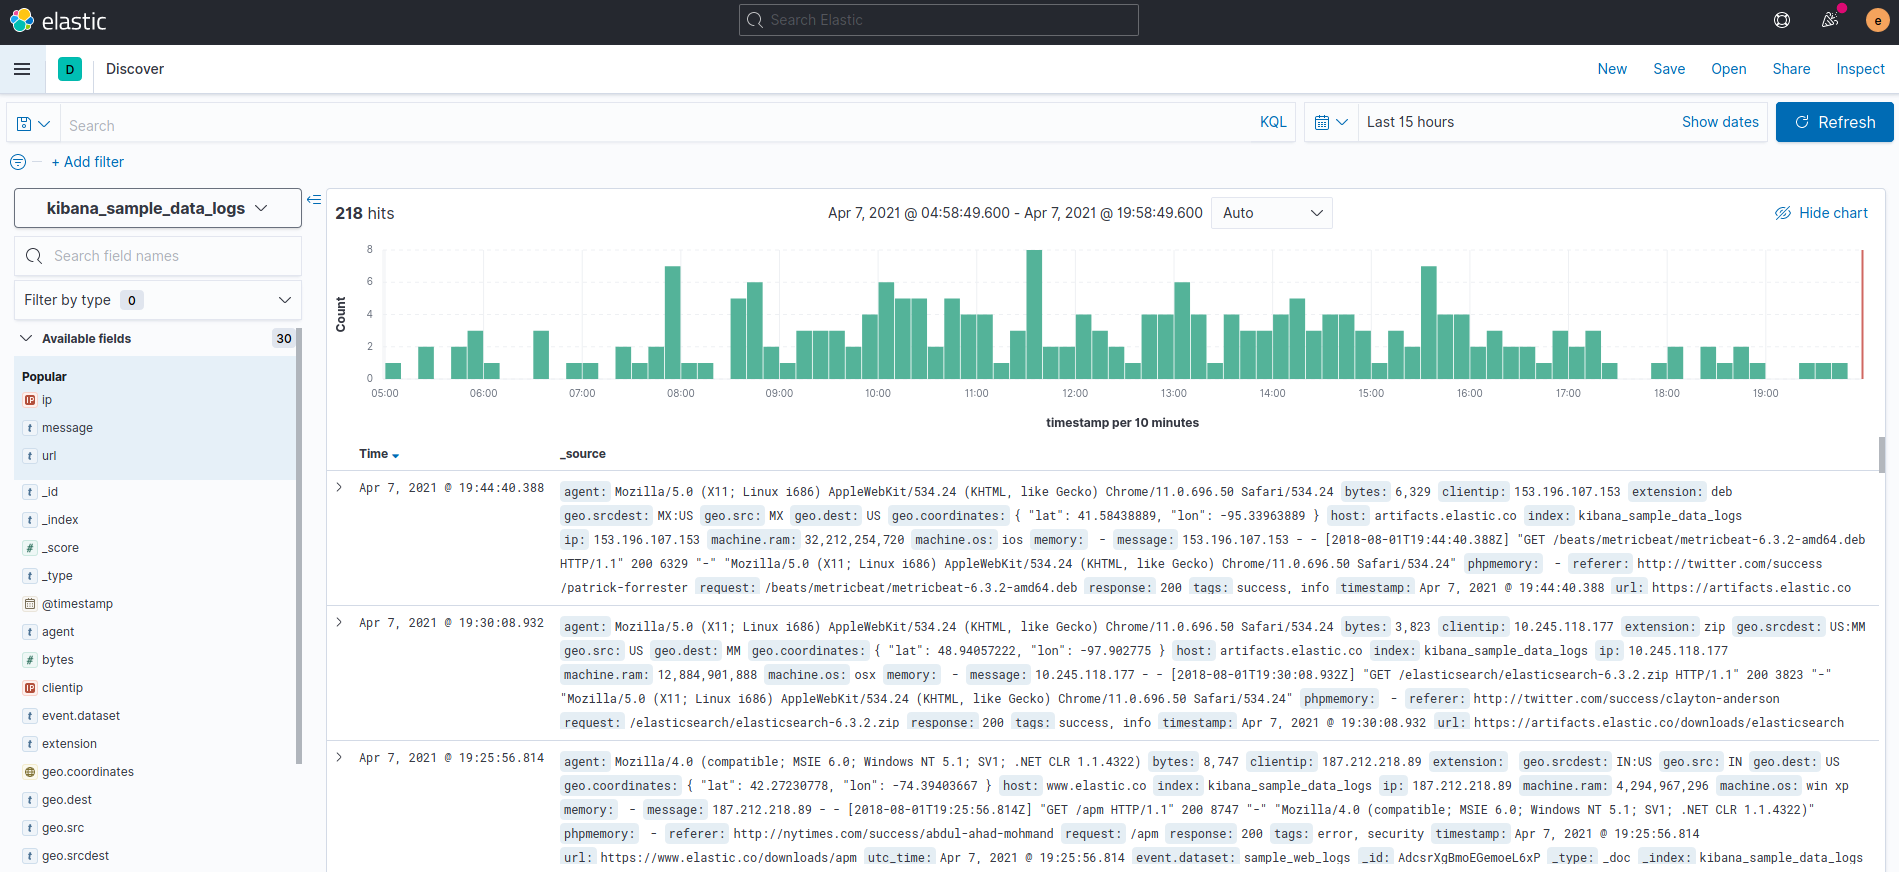
Go to ☰ -> Analytics -> Discover and modify the time range to say 15 hours, and you’ll see something like this:

Since we have Kibana connected, we can skip the usual curl commands to get cluster info. ☰ -> Management -> Dev Tools to open the the HTTP API interface:

Now we can see the Indicies created by Kibana, and the kibana_sample_data_logs index. This is a nice secured interface to query the Cluster REST APIs from.